
Fake It or Drop It? Answering the Question by Estimating How Much Time You Need.
- Neville Huang
- Oct 27, 2020
- 9 min read
Thanks to my job, I have a lot of opportunities to meet and exchange opinions with startup people, who need to constantly engage in innovation. And one question was frequently asked – Is “fake it till you make it” a reasonable thing to do? Or, put it another way, how can we tell whether an idea is truly impossible (so one should not fake it and had better give it up as soon as possible) or just very hard to achieve?
This article will provide a potential answer to the question. First, we will discuss about a related issue, that is, does the “Everything-Is-Possible” mindset benefit innovation? Then, a simple formula and some useful tips will be introduced, so that you can better estimate the feasibility of an idea and decide whether to do it or not.
Everything is possible … Unless there is a time limit!
“Fake it till you make it” philosophy is associated with the attitude of “everything-is-possible” – Since nothing is unachievable, it’s okay to pretend that we’ve accomplished our goal (even though that’s not true) because we are going to make it sooner or later.
To be fair, the “everything-is-possible” mindset is important and generally beneficial for innovation because it can motivate you (and your team) to challenge the intractable and keep moving closer to your dream. However, such optimism should have an upper limit, or you may find yourself forever stuck in some project and eventually achieve nothing.
But how do you decide that upper limit? The key, I believe, lies in “time”! If someone asks you: “Can you build a time machine?” Although the chance is low, the possibility is not zero. But if that person wants you to build a time machine right now, the probability for you to accomplish the task becomes a resounding ZERO. In other words, everything is possible unless you set up a time limit.
Note that the possibility for you to achieve a goal is correlated to how far your deadline is from now. The further your deadline is, the more likely you goal can be completed.
For example, if I’m making an anti-gravity engine and must finish the design now, the chance for me to accomplish the mission is literally zero. But if I can submit my design by next year, that chance may increase a little bit and become, say, 0.001%. With fifty-year time limit, the chance can reach to 1%, for example. And if I (or my team, which can have a longer lifespan through continuously recruiting new members) can work on the project for one million years, the chance should significantly rise, which may come to about 50%, and so on. If we plot the possibility against time, the curve may look like the one shown in Figure 1.
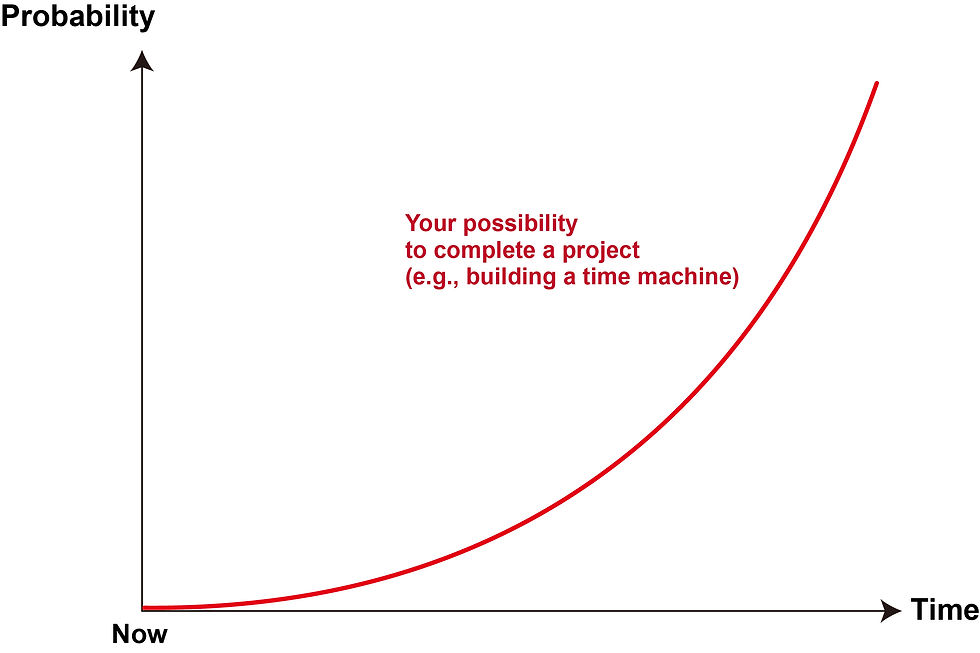
We assume the curve to be exponential since our knowledge, tools and techniques should advance faster and faster in the future due to the development of science and tech. And with this model in mind, we can define a function capable of telling us how long we may need to complete a project.
Estimating how long you may need to complete a project
If we transpose the two axes in Figure 1 and redefine “p” as “the progress of the project”, we should have a curve alike Figure 2, which can be described by the function, T(p):

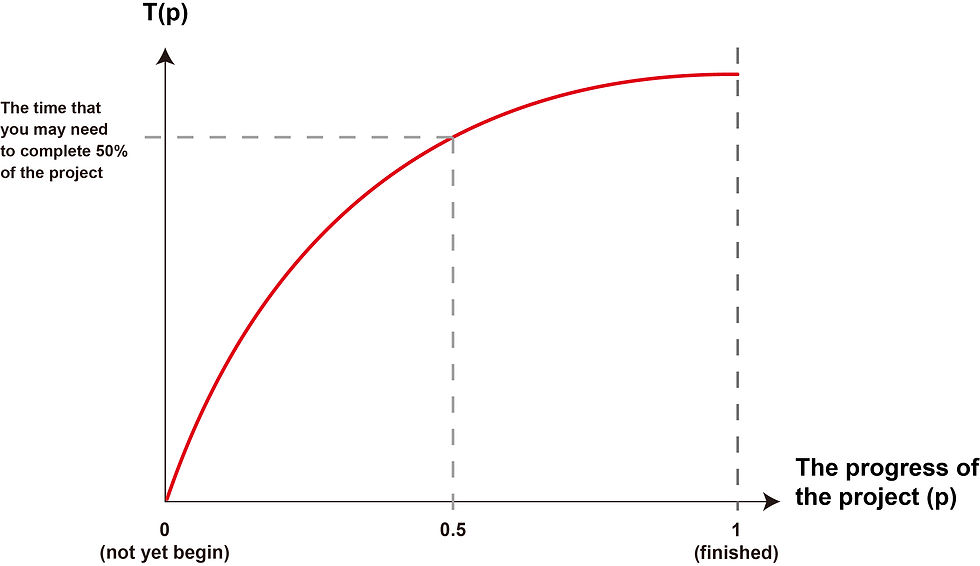
“T(p)” represents the time that one may need to successfully complete a project, which is measured in years; “p” represents the progress of the project, which is a percentage ranges from 0 (not yet begun) to 1 (finished). And “log” stands for the logarithm base 10.
So, for example, to estimate how long you may need to finish half of a project (i.e., p = 0.5), simply calculate T(0.5). If the outcome is 10, it means that you will probably take 10 years to finish 50% of your project.
“+F” and “–F” are positive and negative factors, respectively. “+F” factors will shorten the result of T(p), while “–F” will prolong it. In our model, the positive factors include the time you can spend on a project per day (t), the quality of your team (Q) and your budget for the project (B). The negative factors, on the other hand, include the difficulty of the project (D) and technology readiness (R). They are now discussed in detail below so that you will understand why the function looks the way it is.
Technology readiness (R):
As we can imagine, the more immature a technology is, the more time you may need to build a working product or service based on it. The problem is that how can we measure the readiness of a technology?
Here, we adopt the technology readiness levels (TRL) model proposed by NASA. According to the model, there are nine levels of readiness for a technology (Figure 3):
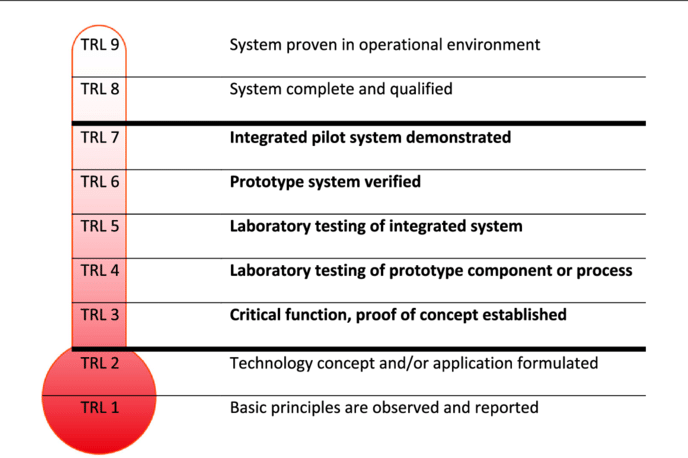
Thus, the lower the TRL is, the longer it will take to complete the project. But how long exactly do we need when TRL = 1? Some observations may help us here.
As we know, the first artificial neural network was invented by Frank Rosenblatt in 1958, but not until 2012 did the technology became prevalent in actual applications. In other words, there is a circa 50-year gap between the birth and maturity of a technique.
The 50-year gap can be observed in other cases, too. For instance, the concept of quantum computing can be traced back to Stephen Wiesner’s conjugate coding in 1969, and Google claimed to have achieved quantum supremacy in 2019; the time gap is 50 years. Brain-computer interface (BCI) shows a similar pattern as well – The technology was first invented in 1970s, and it attracted public attention in around 2018 to 2020. So, we think it’s safe to assume that it may require (at least) 50-year development for a technology at TRL 1 to reach to TRL 9.
As for the technology that has reached to TRL 9, we think it’s safe to assume that you will need less than one year to finish building your system.
Back to our function T(p). Through simple calculations, we know that “log[(x + 1)^a]”, where a is an index, approaches 50 if a = 166 and 1 if a = 3.32, so we can connect TRL and R with the following equation:

As you can see, without considering any other factor, when TRL = 1 (i.e., highly unready), R = 166 and T(1) = 50 (p = 1 means the project is finished). If TRL = 9, R = 2 and T(1) is about 0.6 years. We can also let TRL = 6.5 (i.e., in the middle of TRL 6 and 7), and the resulting R will be 53.25.
How many hours you can spend on the project per day (t):
To simplify our formula, we simply assume that “the longer you can spend on a project each day, the faster you will finish it”. However, note that such assumption is not necessarily true considering that working too long may decrease the productivity of an individual (in fact, according to some researches, the optimal daily working time should be about 6 hours, but to reflect such fact will make the math too complicated for our purpose here).
Factor t will have to be considered together with the team quality factor denoted as Q, which we will enlarge on in the next section.
The quality of your team (Q):
Let’s jump to the conclusion first. If there are n people in your team, we define the team quality factor, Q, as:

The “t with the subscript i” in the formula symbolizes the time that each member in the team can spend on the project. We divide it by 24 to convert it into a ratio, and then sum the ratios from all team members to indicate that how many “time resources” you have on your project.
The “q with the subscript i”represents the “quality of each team member”, which is determined by how professional a team member is with respect to the job assigned to him or her.
But how can we assess how professional a person is? There are multiple methods, but the key here is to compare the performance of that person on a specific task or tasks and the performance of others on the same task(s). For instance, knowing that a person scored 600 on a credible exam is not enough by any sense.
In our model, we take how many people, in percentage, you beat on a credible test (relevant to your assigned job) as our q index. That is to say, with a score of 600, if you are in top 30% of the people who took the same test, then your q = 70%.
If you have taken multiple exams on the same subject (and have beaten 50% and 80% of the people who took the same exams), we’ll calculate your q by simply average your performance data (i.e., 1/2 * (80% + 50%) = 65%).
Finally, to get the overall team quality index Q, we add the time and quality factors for each team member together, and then multiply the sum by n as a weighting.
The reason of “multiplying by n” is as follows. As we can see, both “t / 24” and “q” are small (ranges from 0 to 1), but human factors are indeed very crucial for the success of a project, so we must scale up the result with reasonable weighting. In our model, we choose “n (i.e., the number of team members)” to be such weighting because, in general, the more people you can use, the more likely your project can go smoothly since each member can take a smaller burden.
The budget you have (B):
The budget index, B, is defined in the following fashion:

“b” is the money that you and your team can use, and “E[b]” means the expected budget that your project may need. Note that E[b] can be obtained by adding up all the money you may have to spend, and referring to other successful projects that are similar to yours.
The difficulty of the project (D):
The difficulty of a project is decided by many factors (e.g., how much money do similar projects usually require, how ready the technologies involved are and so on), and some of them have already be covered by other terms in the formula. Therefore, the difficulty index (D) here only considers a specific yet very important thing, that is, how many technical obstacles and potential solutions you can think of. To be more specific, D is defined as follows:

So, if a project involves, say, 12 major technical problems that you and your team need to overcome, and there are 16 potential solutions you can immediately try out to tackle them (some problems may have multiple solutions), then the D of the project should be 12/16 = 0.75.
Note that if you encounter at least one technical issue, and that issue is so difficult that you and your team can think of nothing to resolve it (i.e., the number of potential solutions = 0), then index D will approach to infinite, and T(p) will approach to infinite correspondingly. Such result means that you should seriously consider giving up your current idea and find a new one.
For your convenience, we now summarize the function said in below:
The Time-Estimating Function

Technology readiness (R):

TRL is “technology readiness levels” proposed by NASA (1 ≤ TRL ≤ 9).
Project’s difficulty (D):
The budget you have (B):
The index b represents the budget you have, and E[b] is the expected budget you may need.
The quality of your team (Q):
Given that there are n people in your team, index t stands for how many hours each team member can work on the project per day, and q represents how professional each of your team member is.
Of course, we must point out that the formula above is not the only model you can adopt. In fact, it’s not even the most reasonable one since we’ve introduced many rather arbitrary assumptions (for example, we assume that it will take 50 years for a theoretical concept to go into actual practice; but for more unrealistic project, such as building a time machine, we expect the time needed to be even longer). However, it can definitely give you a reference if you currently have nothing to work with.
How to implement “Fake it till you make it”?
So, how can the function said help us to determine whether an idea is impossible (so we should drop it) or just very hard to accomplish (so it’s worth trying)? The key, in our opinion, is that we should stop thinking in the language of possible / impossible and start using the language of time.
The function described above can give you a rough estimation of the time that you may need to realize an idea (let p = 1 and calculate the value of T(p)). If such time is longer than you can bear (> 10 years, for example), then you may want to drop it and pick a new idea to work on. If, however, the project may be completed in, say 1 to 2 years, then you may consider adopting “fake it till you make it” strategy!
Footnote: Neurozo Innovation provides viewpoints, knowledge and strategies to help you succeed in your innovating journey. If you have any question for us, please feel free to leave a comment below or e-mail us.
For more articles like this, please follow our Twitter, Facebook page, or LinkedIn. Thank you very much for your time, and we wish you a wonderful day!
this is something I never expected internet to offer. Very nice indeed. Thanks.